Data Analyst Course Syllabus (2026): What 14 Courses Actually Teach
 By Prince Dewani, Contributor at BootcampGuide.
MBA (SAGE University), certified in Selenium, Cypress, Playwright, Appium and Automation Testing. Published . 14 min read
Topics: Data Analytics, Syllabus, Data Analyst Course, India, Original Research
By Prince Dewani, for BootcampGuide. Every module list below was read off the provider's own course page, exam guide or official course listing on 1 November 2026, from an Indian connection. Module names are quoted as published; counts and sums are our own. We list courses from several of these institutes; none of them paid to appear in this article or saw it before it was published. See sources.
A data analyst course syllabus in India is built on three tools that almost every course teaches: Excel, SQL and Python. Most add Power BI or Tableau for dashboards, statistics, and a capstone project. Where courses really differ is what comes after that: machine learning, generative AI tools, and how many hours each subject actually gets.
We read 14 syllabi side by side, from Cisco's free course and NPTEL to Google, IBM, six bootcamps and three IIT-linked programmes, and we added Microsoft's Power BI exam and IIT Madras' degree for comparison. Below is what each one teaches, in what order, for how many hours, and how to tell which syllabus fits the job you want. The whole comparison is also available as a free two-page PDF, with no sign-up needed.
The common data analyst course syllabus
| Subject | What it covers | In how many of the 14 syllabi |
|---|---|---|
| Excel or Google Sheets | Formulas, lookups, cleaning, pivot tables, charts | 13 |
| SQL | Queries, joins, aggregates, subqueries, window functions | 13 |
| Python | pandas, NumPy, Matplotlib, Seaborn, exploratory data analysis | 13 |
| Capstone project | An end-to-end analysis on a real or realistic dataset | 12 |
| Power BI | Power Query, data modelling, DAX, dashboards | 9 |
| Statistics | Descriptive statistics, distributions, sampling, hypothesis tests | 9 |
| Generative AI | Copilot in Excel and Power BI, prompting, AI-assisted analysis | 9 |
| Tableau | Charts, calculated fields, interactive dashboards | 8, 2 of them optional |
| Machine learning | Regression, classification and clustering basics | 7, 1 of them basic |
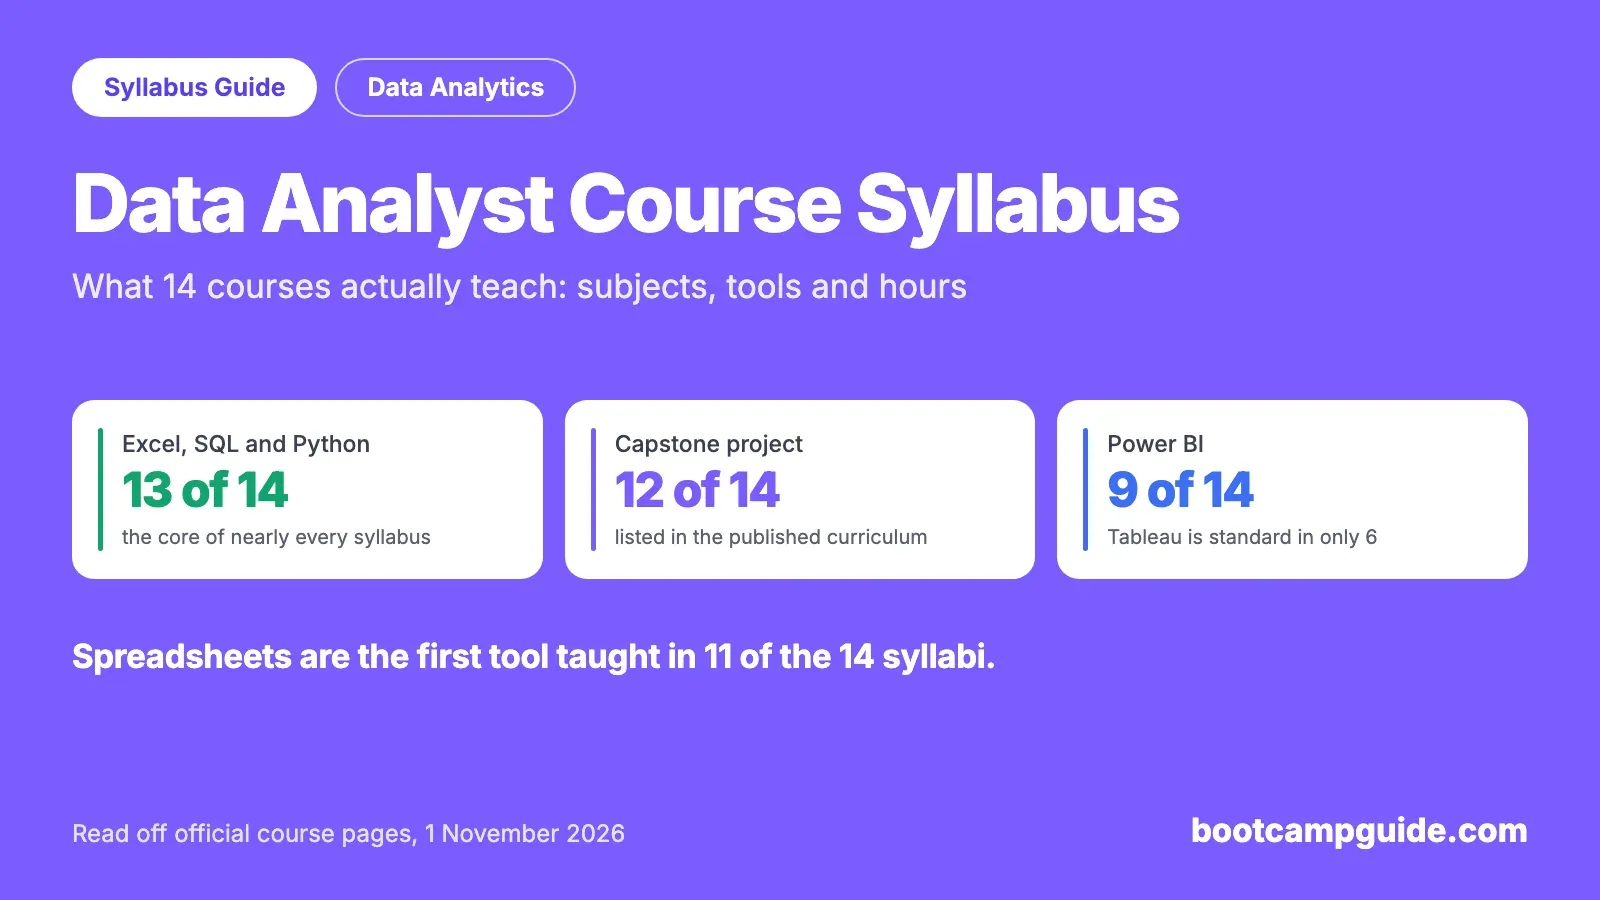
Key takeaway: Excel, SQL and Python appear in 13 of the 14 syllabi, so they are the data analyst subjects you can treat as non-negotiable. Power BI and statistics are in 9. Treat machine learning as optional: only 7 include it, and one of those only at a basic level. If a course leaves out one of the big three, know why before you pay.
14 data analytics course syllabi, side by side
| Course | Excel or Sheets | SQL | Power BI | Tableau | Python | Statistics | Machine learning | Generative AI | Capstone |
|---|---|---|---|---|---|---|---|---|---|
| Cisco Data Analytics Essentials | Yes | Yes | - | Yes | - | Yes | - | - | - |
| Google Data Analytics (Coursera) | Yes | Yes | - | Yes | Yes | - | - | - | Yes |
| IBM Data Analyst (Coursera) | Yes | Yes | - | - | Yes | - | Basic | Yes | Yes |
| NPTEL, IIT Roorkee | - | - | - | - | Yes | Yes | Yes | - | - |
| Codebasics | Yes | Yes | Yes | Yes | Yes | Yes | - | Yes | Yes |
| PW Skills | Yes | Yes | Yes | Yes | Yes | Yes | Yes | Yes | Yes |
| ExcelR | Yes | Yes | Yes | Yes | Yes | Yes | - | Yes | Yes |
| DataMites | Yes | Yes | Yes | Yes | Yes | Yes | Yes | - | Yes |
| AccioJob | Yes | Yes | Yes | - | Yes | Yes | - | Yes | Yes |
| AnalytixLabs | Yes | Yes | Yes | Optional | Yes | Yes | Yes | Yes | Yes |
| Masai, IIT Roorkee | Yes | Yes | - | - | Yes | - | - | Yes | Yes |
| Simplilearn, IIT Kanpur | Yes | Yes | Yes | Elective | Yes | - | Yes | Yes | Yes |
| Intellipaat, IITM Pravartak | Yes | Yes | Yes | - | Yes | Yes | Yes | - | Yes |
| Coding Ninjas | Yes | Yes | Yes | - | Yes | - | - | Yes | Yes |
"Yes" means the subject is named in the published curriculum. "-" means it is not listed on the page, not that it is never mentioned in class. Ask the provider if a subject matters to you.
Three things stand out. Only PW Skills' page lists all nine subjects. Spreadsheets are the first tool taught in 11 of the 14, which is why almost every data analyst syllabus starts the same way. And Tableau has become the second choice: 9 courses include Power BI, and only 6 include Tableau as a standard part of the course.
Data analyst course subjects, explained
Excel syllabus for data analysts
Expect functions such as SUMIFS and IF, VLOOKUP and INDEX MATCH, data validation, cleaning, pivot tables, charts, and dashboards. Better courses add Power Query. ExcelR's published outline runs from cell referencing to INDEX MATCH, INDIRECT and OFFSET. AccioJob's first unit covers functions, lookups, pivot tables and data cleaning.
SQL syllabus for data analysts
Start with SELECT, filtering and aggregates, then joins, subqueries and window functions. AccioJob's unit runs from RDBMS basics through normalisation, aggregate functions, joins, unions and nested queries. Google teaches SQL across its Prepare, Process and Analyze courses, which shows how the language is used: to get and clean data, not as a subject on its own.
Python syllabus for data analysts
You need basics, data structures, functions, and then the libraries: pandas and NumPy for analysis, Matplotlib and Seaborn for charts. DataMites splits this into four Python modules before any analysis. Most analysts do not need web development or object-oriented depth, so a Python section heavy on those is a sign of a recycled course.
Power BI syllabus: what Microsoft tests
| PL-300 skill area | Share of the exam |
|---|---|
| Prepare the data | 25 to 30% |
| Model the data | 25 to 30% |
| Visualize and analyze the data | 25 to 30% |
| Manage and secure Power BI | 15 to 20% |
This is the most reliable Power BI syllabus available, because Microsoft publishes it in the PL-300 study guide. Notice that charts are only part of one area. More than half of the exam is preparing and modelling data, so a course that spends its time on visuals alone will leave a gap. Coding Ninjas says its Power BI module is aligned with PL-300 and includes a free exam voucher, subject to finishing 80% of that module and clearing its assessments.
Statistics syllabus for data analysts
You need mean, median, variance, distributions, sampling, correlation and hypothesis testing. NPTEL goes furthest here: its 12 weeks run from probability and sampling through ANOVA, regression and chi-square tests. Five of the 14 syllabi do not list statistics as a subject at all, including Simplilearn's and Masai's, so check where it is taught.
Machine learning and generative AI in a data analyst syllabus
PW Skills' Machine Learning Essentials covers regression basics, classification basics and model evaluation for business use. That is about the right depth for an analyst. On generative AI, PW Skills teaches Excel Copilot, Power BI AI and Tableau Pulse across the course, while Simplilearn adds separate modules on AI automation and AI agents. Masai's IIT Roorkee programme goes furthest, with modules on LLM frameworks, prompt engineering and LangChain and CrewAI agents. Useful, but AI tools sit on top of the basics rather than replacing them.
Free and low-cost course syllabi
Cisco Data Analytics Essentials (free, 30 hours)
Cisco's course has 10 modules and 29 labs: Data Analytics Projects; Data Gathering and Investigation; Preparing and Cleaning Data; Transforming Data with Excel; Analyze the Data Using Statistics; Relational Databases and SQL; Structured Queries; Introduction to Tableau; Ethics and Bias in Data; and Take the Next Steps. It is the best free overview, with more than 8.3 lakh learners enrolled. It does not teach Python or include a capstone.
Google Data Analytics Certificate syllabus (152 hours)
| Course | Hours |
|---|---|
| 1. Foundations: Data, Data, Everywhere | 13 |
| 2. Ask Questions to Make Data-Driven Decisions | 15 |
| 3. Prepare Data for Exploration | 19 |
| 4. Process Data from Dirty to Clean | 16 |
| 5. Analyze Data to Answer Questions | 26 |
| 6. Share Data Through the Art of Visualization | 19 |
| 7. Introduction to Data Analysis Using Python | 27 |
| 8. Google Data Analytics Capstone: Complete a Case Study | 11 |
| 9. Accelerate Your Job Search with AI | 6 |
Coursera's page covers spreadsheets, SQL and Tableau. One warning: the page contradicts itself. Course 7 is called Introduction to Data Analysis Using Python, while its FAQ still says the programme teaches R and "We do not cover Python in the curriculum". We went by the course list, but check the current course before you enrol if Python is why you are choosing it. The certificate does not teach Power BI.
IBM Data Analyst Professional Certificate syllabus (11 courses)
IBM's certificate runs through Data Analytics Foundations; Excel for Data Analysis; Data Visualization and Dashboards with Excel and Cognos; Python for Data Science and AI; a Python project; Databases and SQL; Data Analysis with Python; Data Visualization with Python; a capstone; Generative AI for data analytics; and a career guide. It leans heavily on Python, and it teaches IBM Cognos rather than Power BI or Tableau, which matters if the jobs you want ask for either by name.
NPTEL Data Analytics with Python syllabus (IIT Roorkee, 12 weeks)
NPTEL's course, taught by Prof. A Ramesh, is the most statistical here: Python basics, probability and sampling, hypothesis testing and ANOVA, regression and logistic regression, chi-square tests, clustering, and classification and regression trees. It is free to follow, with a ₹1,000 proctored exam for a certificate. It has no SQL, Excel or dashboard tools, so pair it with Cisco's course. Its last run ended in April 2026, so check NPTEL for the next one.
Bootcamp syllabi
Codebasics Data Analytics Bootcamp
Codebasics publishes every module with its video length, so you can see exactly what you get. Its hours are in the table below. The order is Excel and Basic Statistics, Power BI, SQL, Python, then a Tableau Mini, Fabric Mini, AI for Data Analysts, and sections on data engineering, dbt and AI automation.
PW Skills Data Analytics with AI (5 months)
PW Skills' published syllabus has 10 categories: Introduction to Data Analytics, Excel, Statistics, SQL, Power BI, Tableau, Reporting Concepts, Python, Machine Learning Essentials and Gen AI. It is the widest syllabus for the length, so ask how many hours each tool receives.
ExcelR AI Powered Data Analyst (6 months, 190+ hours)
ExcelR's core curriculum is four tools: Excel, MySQL, Tableau and Power BI. Python, R, business statistics, SAS and ChatGPT are listed as value adds, which suggests they sit outside the main teaching. It claims 30+ assignments and 20+ capstone projects.
DataMites Certified Data Analyst (6 months, 200+ hours)
DataMites publishes the longest module list here: Data Analysis Foundation, Python Foundation, Statistics Essentials, Data Analysis Associate, Advanced Data Analytics, Predictive Analytics with ML, Database with SQL and MongoDB, Big Data Foundation including PySpark, and BI Analyst covering Tableau and Power BI. It is close to a data science syllabus, and it is one of the few here that goes into big data.
AccioJob Data Analytics with GenAI (6 months)
AccioJob teaches four units, Microsoft Excel, SQL, Python and Microsoft Power BI, each from beginner to advanced. Its FAQ adds statistics, data visualisation and AI-powered analytics, with 10+ projects.
AnalytixLabs Data Analytics with AI (6 to 8 months)
AnalytixLabs publishes a term-by-term table with class hours. Term 1 covers problem solving, maths and statistics, business intelligence with Excel and Power BI, and SQL. Term 2 covers Python, statistics, predictive modelling and industry applications in marketing, operations and risk. Term 3 is a capstone and placement preparation. Tableau is optional, and its page shows that the AI-track modules are available only in the live online format, not in classrooms.
IIT-linked course syllabi
Simplilearn with E&ICT Academy, IIT Kanpur (7 months)
The modules are Foundations of Data Analytics and ETL Workflows; AI-Powered Business Analytics with Excel and Copilot; Data Manipulation with SQL; Data Analysis and Visualization with Python; Data Visualization and Storytelling using Power BI; Predictive Analytics and Machine Learning; AI Automation for Data Workflows; Introduction to AI in Azure; Analytics Integration with Cloud AI Platforms; AI Agents for Data Analytics; Data Ethics, Privacy and Responsible AI; and a capstone. Tableau is an elective.
Intellipaat with IITM Pravartak (7 months)
This syllabus starts with SQL rather than Excel, then Python, Statistics and Probability, Machine Learning, Supervised and Unsupervised Learning, Time-Series Forecasting, Business Problem Solving and Storytelling, KNIME, Data Modeling, Spark (self-paced), a capstone, Business Case Studies, Excel, Data Warehousing and Power BI. It is one of the most technical here.
Masai with E&ICT Academy, IIT Roorkee (6 months)
Masai's five modules are Core Data Architecture and Analytical Foundations; LLM Frameworks and Strategic Prompt Engineering; Intelligence-Driven Wrangling and Visual Narratives; Architecting Agentic Systems and Automation; and a Capstone. Its page lists Google Sheets, SQL, Python and Matplotlib, and does not list Power BI, Tableau or statistics. That makes it a different product: closer to AI automation for analysts than to a standard analyst syllabus.
Coding Ninjas Data Analytics Job Bootcamp
Coding Ninjas' page opens with Data Analytics with Excel in week 1, then SQL and Python programming in week 2, and Exploratory Data Analysis and data visualisation in week 3, and its IBM and Microsoft version lists 15+ hours of Power BI and 34 hours of pre-recorded IBM lectures. It says the course "focuses on core analytics skills, but basic ML concepts may be introduced in later stages".
How many hours each subject gets
Few providers publish this. Codebasics and AnalytixLabs do, and they show how much the weight varies.
| Subject | Codebasics (recorded video) | AnalytixLabs (class hours) |
|---|---|---|
| Excel | 9.8 hours | 30, Excel and Power BI together |
| Power BI | 25.6 hours | |
| SQL | 11.7 hours | 30 |
| Python, statistics and modelling | 18.8 hours (Python) | 54 |
| Tableau | 4.6 hours | Optional |
| AI tools | 17.4 hours | Separate AI track |
| Capstone or portfolio | 6 hours, plus projects | 20, plus 130 of assessment and self-study |
AnalytixLabs' table totals 263 class hours, 66 of assessment and 575 of self-study. Self-study is more than twice the teaching, which is a useful reality check on any "6-month" label. Google, at 152 hours, gives its Analyze course 26 hours and its Python course 27. The takeaway: if a provider will not tell you the hours per tool, you cannot compare its syllabus with anyone else's. We ran the same exercise on what an hour of teaching costs on data analyst courses.
A 6-month data analytics syllabus, month by month
This is our suggested order, based on how most of these courses begin and build. Adjust it to the hours you have.
| Month | Subject | Finish with |
|---|---|---|
| 1 | Excel and basic statistics | A cleaned dataset and a pivot-table summary |
| 2 | SQL | Joins and window functions on a real database |
| 3 | Power BI or Tableau | A published dashboard |
| 4 | Python with pandas | An exploratory analysis in a notebook |
| 5 | Statistics, hypothesis tests and AI tools | An A/B test write-up |
| 6 | Capstone, portfolio and interview practice | Two or three projects you can explain |
Skills required for a data analyst, and the tools to learn
The skills required for a data analyst split into three groups, and a good syllabus teaches all of them.
- Technical skills: Excel, SQL, a BI tool, Python, and enough statistics to know when a result is real.
- Analytical skills: framing a business question, spotting bad data, and choosing the right chart. Google gives this its own course, Ask Questions to Make Data-Driven Decisions, and AnalytixLabs a structured problem-solving module.
- Communication skills: explaining a finding to someone who does not care about the method. Look for "storytelling" in the syllabus, as in Intellipaat's and PW Skills'.
The core data analyst tools are Excel or Google Sheets, MySQL or PostgreSQL, Power BI or Tableau, Python with pandas, and Jupyter or Google Colab. After that, cloud tools such as BigQuery and Microsoft Fabric, plus Copilot, are useful additions. Codebasics adds dbt and Fabric, and DataMites adds PySpark, which is the start of a big data analytics syllabus.
Which syllabus fits which job
| Target role | Syllabus to look for | Good fits among these |
|---|---|---|
| MIS or reporting analyst | Excel, SQL, Power BI | ExcelR, Codebasics |
| Data analyst | Excel, SQL, Power BI or Tableau, Python, statistics, capstone | PW Skills, AccioJob, AnalytixLabs, Codebasics |
| Business analyst | Excel, SQL, Power BI, problem solving, requirements | AnalytixLabs |
| Data analyst moving towards data science | Python, statistics, machine learning | DataMites, Intellipaat, NPTEL |
| Analyst using AI automation | Python, LLMs, agents | Masai, Simplilearn |
A business analyst course syllabus usually shares the Excel, SQL and Power BI core, then swaps Python depth for requirements gathering, process mapping and stakeholder work. Check the role you want, because "business analyst" means very different things across companies. If your goal is data science, compare the top data science institutes in India as well.
Data analyst course eligibility and syllabus after 12th
You can start the free courses here after 12th, or sooner. Cisco, Google and IBM ask for no degree or experience. Paid courses set their own rules: Simplilearn's IIT Kanpur programme asks for a bachelor's degree with an average of 50% or higher, and no coding background. Employers often want a degree even when a course does not, so check this against the jobs you plan to apply for.
For a degree route after 12th, the IIT Madras BS in Data Science and Applications starts with an eight-course Foundation level: Mathematics for Data Science I and II, Statistics for Data Science I and II, Computational Thinking, Programming in Python, and English I and II. Its Diploma level then adds subjects such as Business Data Management and Tools in Data Science. Compare that with the bootcamps above: a degree spends far longer on maths and statistics, and gives you more time for fundamentals. Bootcamp versus degree in India sets out the trade-offs.
"Data analyst course kitne saal ka hota hai?" A certificate course usually takes 3 to 12 months, and a degree 3 to 4 years. See data analyst course fees in India for what each costs, and data analyst salary in India for what the job pays.
How to judge a data analyst course syllabus
- Check for the core: Excel, SQL, a BI tool, Python and statistics. Anything missing should be a deliberate choice.
- Ask for hours per tool. A long list across a short course means shallow coverage.
- Read the project list. Ask who reviews your work, and whether the dataset is one every other student has used.
- Check how recent it is. Copilot and AI tools should appear, but on top of the basics.
- Look at the order. SQL before Python is normal. A course that opens with machine learning is aimed at someone else.
- Read the fine print. "Value add" and "self-paced" modules are not the same as live teaching.
- Compare with job posts. Pick ten analyst jobs in your city and count the tools they ask for.
You can compare formats, dates and batches in the full course listing, or browse every institute we list. If you are new to bootcamps, our nine-step guide to choosing one walks through the rest of the decision, and for placement terms see pay after placement explained. We compared syllabi the same way for cyber security courses, and if AI is the bigger goal, see AI course fees in India.
Sources and how we checked
We read each provider's course page on 1 November 2026, from an Indian connection, and counted a subject only if the published curriculum names it. Marketing copy elsewhere on a page did not count, so a dash means "not listed", not "never taught". "First tool taught" means the first named software tool in the published order. Simplilearn's and Coursera's pages would not load in our browser, so we read them through a separate page fetch. NPTEL's week-by-week plan comes from NPTEL's course listing through a search of its site, because the live course page did not load its content for us. Video hours for Codebasics and class hours for AnalytixLabs are as published; groupings and sums are ours. Syllabi change between batches, so check the current one before paying.
- Cisco Networking Academy: Data Analytics Essentials
- Coursera: Google Data Analytics Professional Certificate
- Coursera: IBM Data Analyst Professional Certificate
- NPTEL: Data Analytics with Python, IIT Roorkee and its course plan PDF
- Microsoft Learn: PL-300 study guide
- Codebasics: Data Analytics Bootcamp
- PW Skills: Data Analytics With AI
- ExcelR: AI Powered Data Analyst Course
- DataMites: Certified Data Analyst
- AccioJob: Data Analytics with GenAI
- AnalytixLabs: Data Analytics with AI
- Simplilearn: AI-Powered Data Analytics, E&ICT Academy IIT Kanpur
- Intellipaat: Data Analytics for Business with IITM Pravartak
- Masai School: Data Analytics with AI and Gen AI, E&ICT Academy IIT Roorkee
- Coding Ninjas: Data Analytics Job Bootcamp
- IIT Madras: BS programme structure